

This lab has been modernised but not yet verified end to end. Tell us if something breaks.
Building Grafana Dashboards
On this page
Lab Solution
This is quite fiddly, but worth doing because you'll use these a lot.
Configure the heatmap
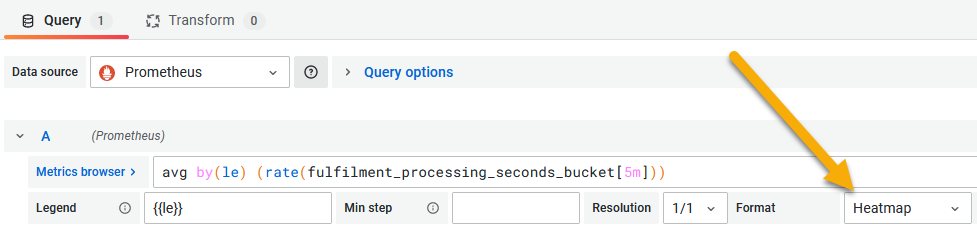
Start with a new panel using the query:
avg by(le) (rate(fulfilment_processing_seconds_bucket[5m]))Set the format in the query panel to be Heatmap:
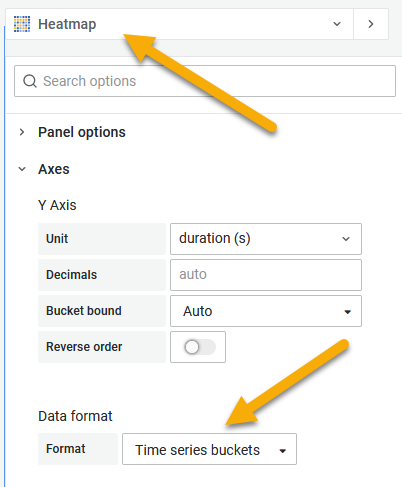
Then in the display options set the visualization type to Heatmap and under the Axes section, set the Data format to Time series buckets:
Sample solution
You can load the completed dashboard with the heatmap from lab/dashboard.json.