

Bu lab henuz cevrilmedi - Ingilizce surumu gosteriliyor.
Bu lab modernize edildi ama ucтan uca dogrulanmadi. Takilirsaniz bize bildirin.
Building Grafana Dashboards
Lab Solution
This is quite fiddly, but worth doing because you'll use these a lot.
Configure the heatmap
Start with a new panel using the query:
avg by(le) (rate(fulfilment_processing_seconds_bucket[5m]))Set the format in the query panel to be Heatmap:
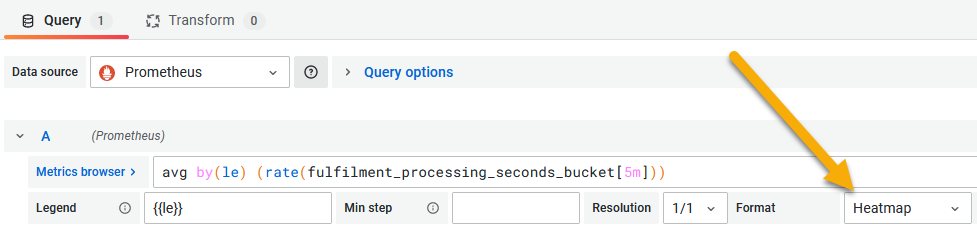
Then in the display options set the visualization type to Heatmap and under the Axes section, set the Data format to Time series buckets:
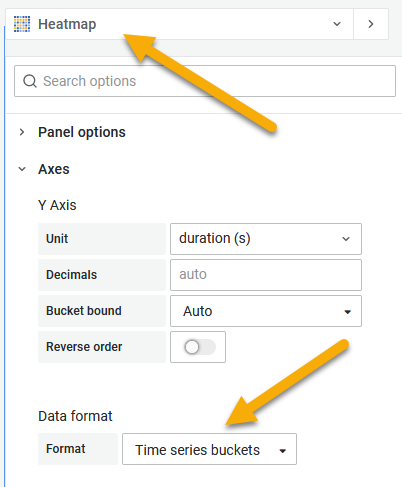
Sample solution
You can load the completed dashboard with the heatmap from lab/dashboard.json.