

Bu lab henuz cevrilmedi - Ingilizce surumu gosteriliyor.
Bu lab modernize edildi ama ucтan uca dogrulanmadi. Takilirsaniz bize bildirin.
Monitoring
Lab Solution
My solution uses two new scrape configs, one for cAdvisor and one for kube-state-metrics:
Deploy the change:
kubectl apply -f ./labs/monitoring/solution/prometheus-config.yamlTrigger a rollout to load the new config:
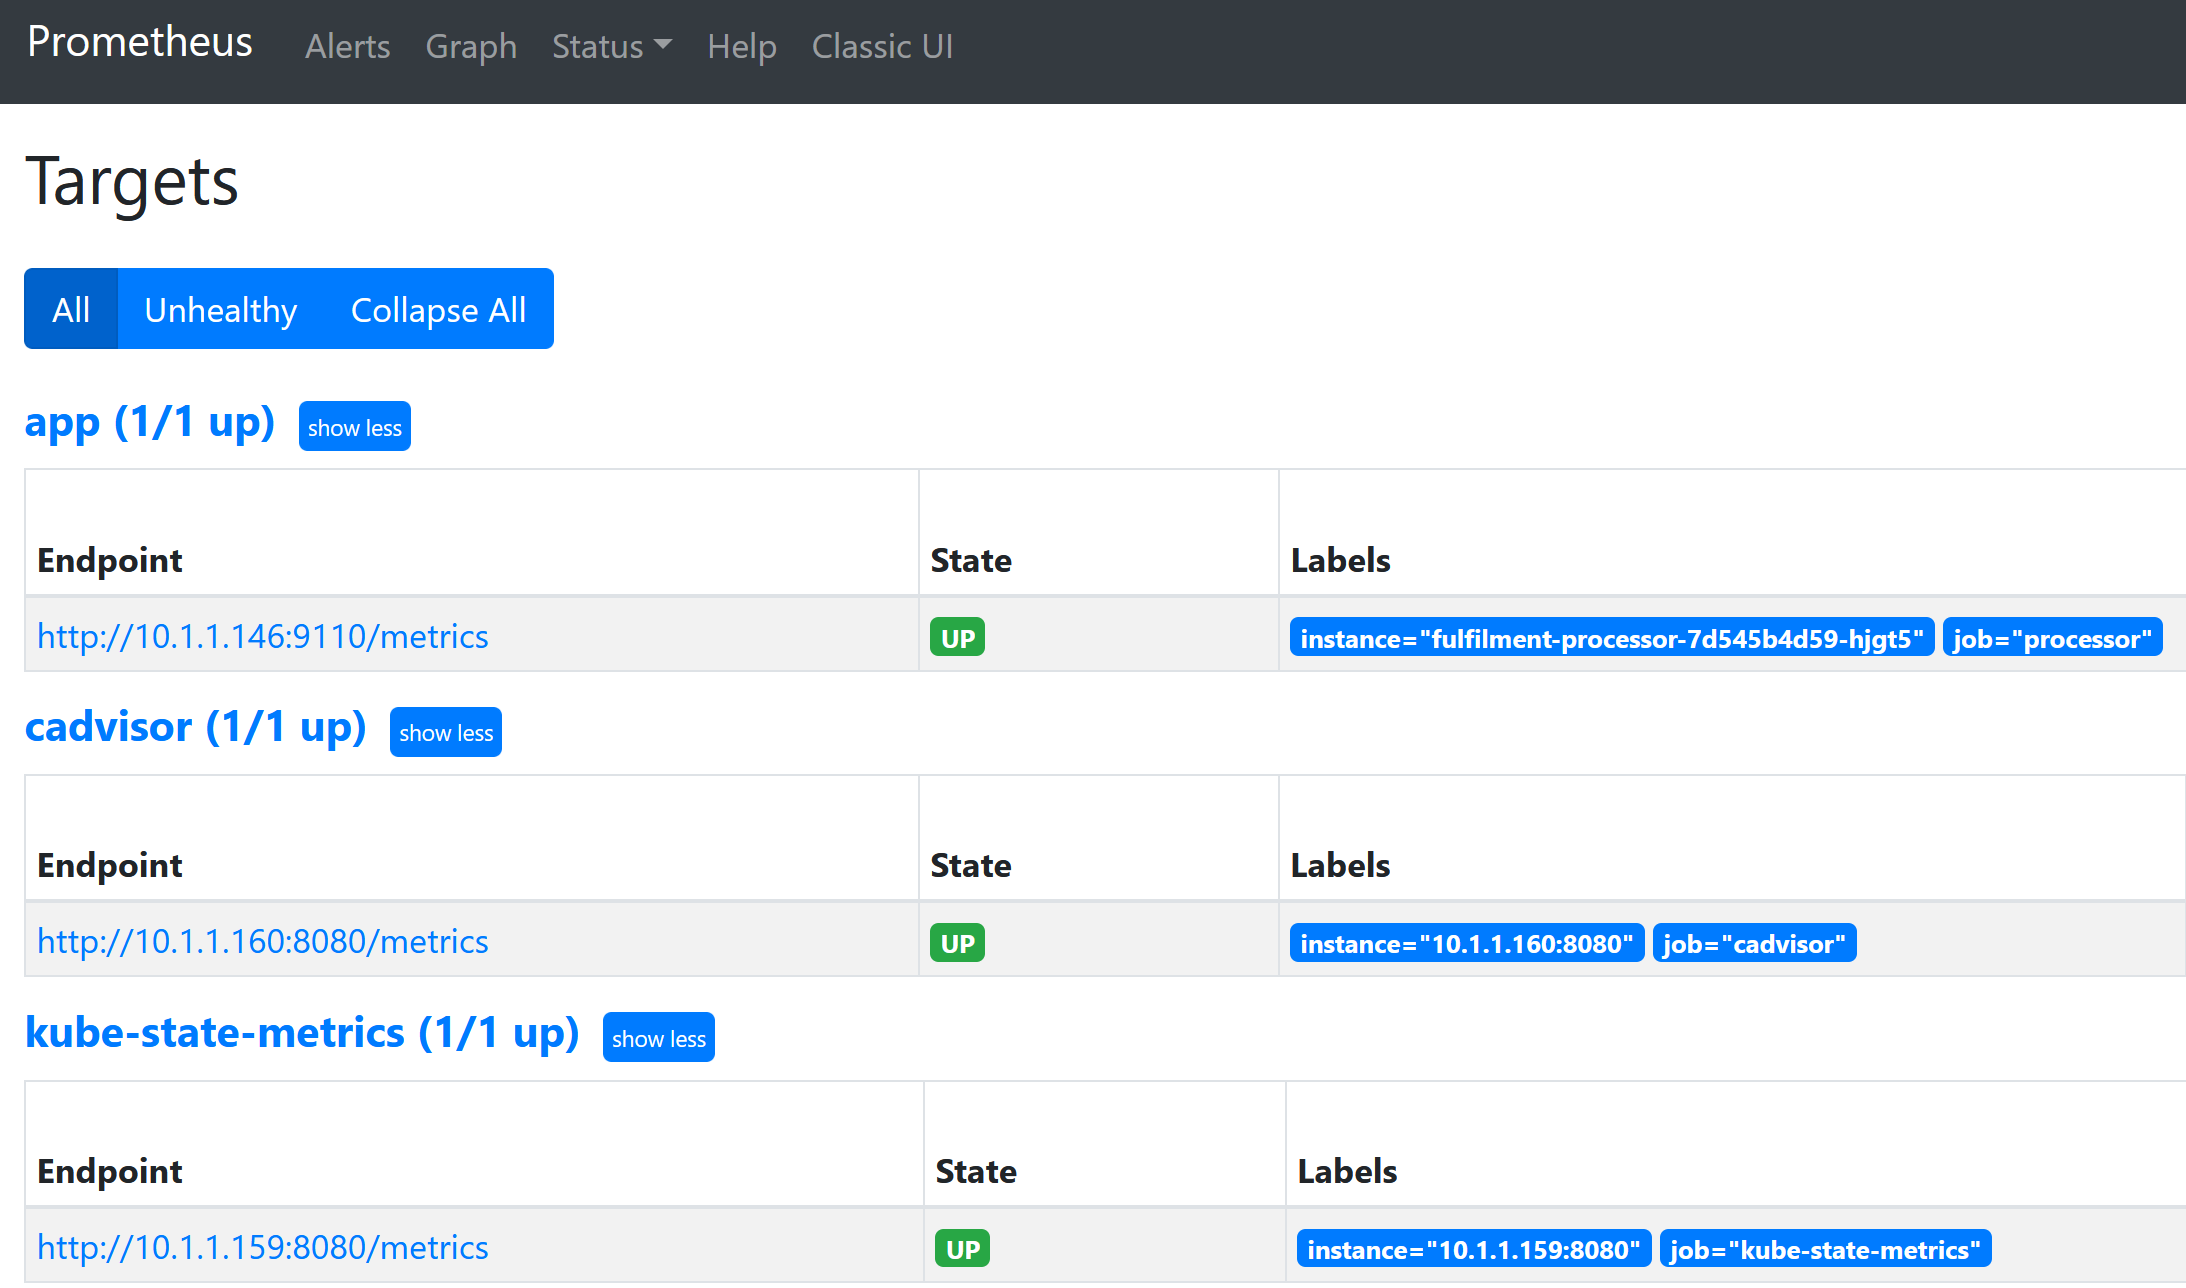
kubectl -n monitoring rollout restart deploy/prometheusBrowse to Prometheus target config check the new targets are up:
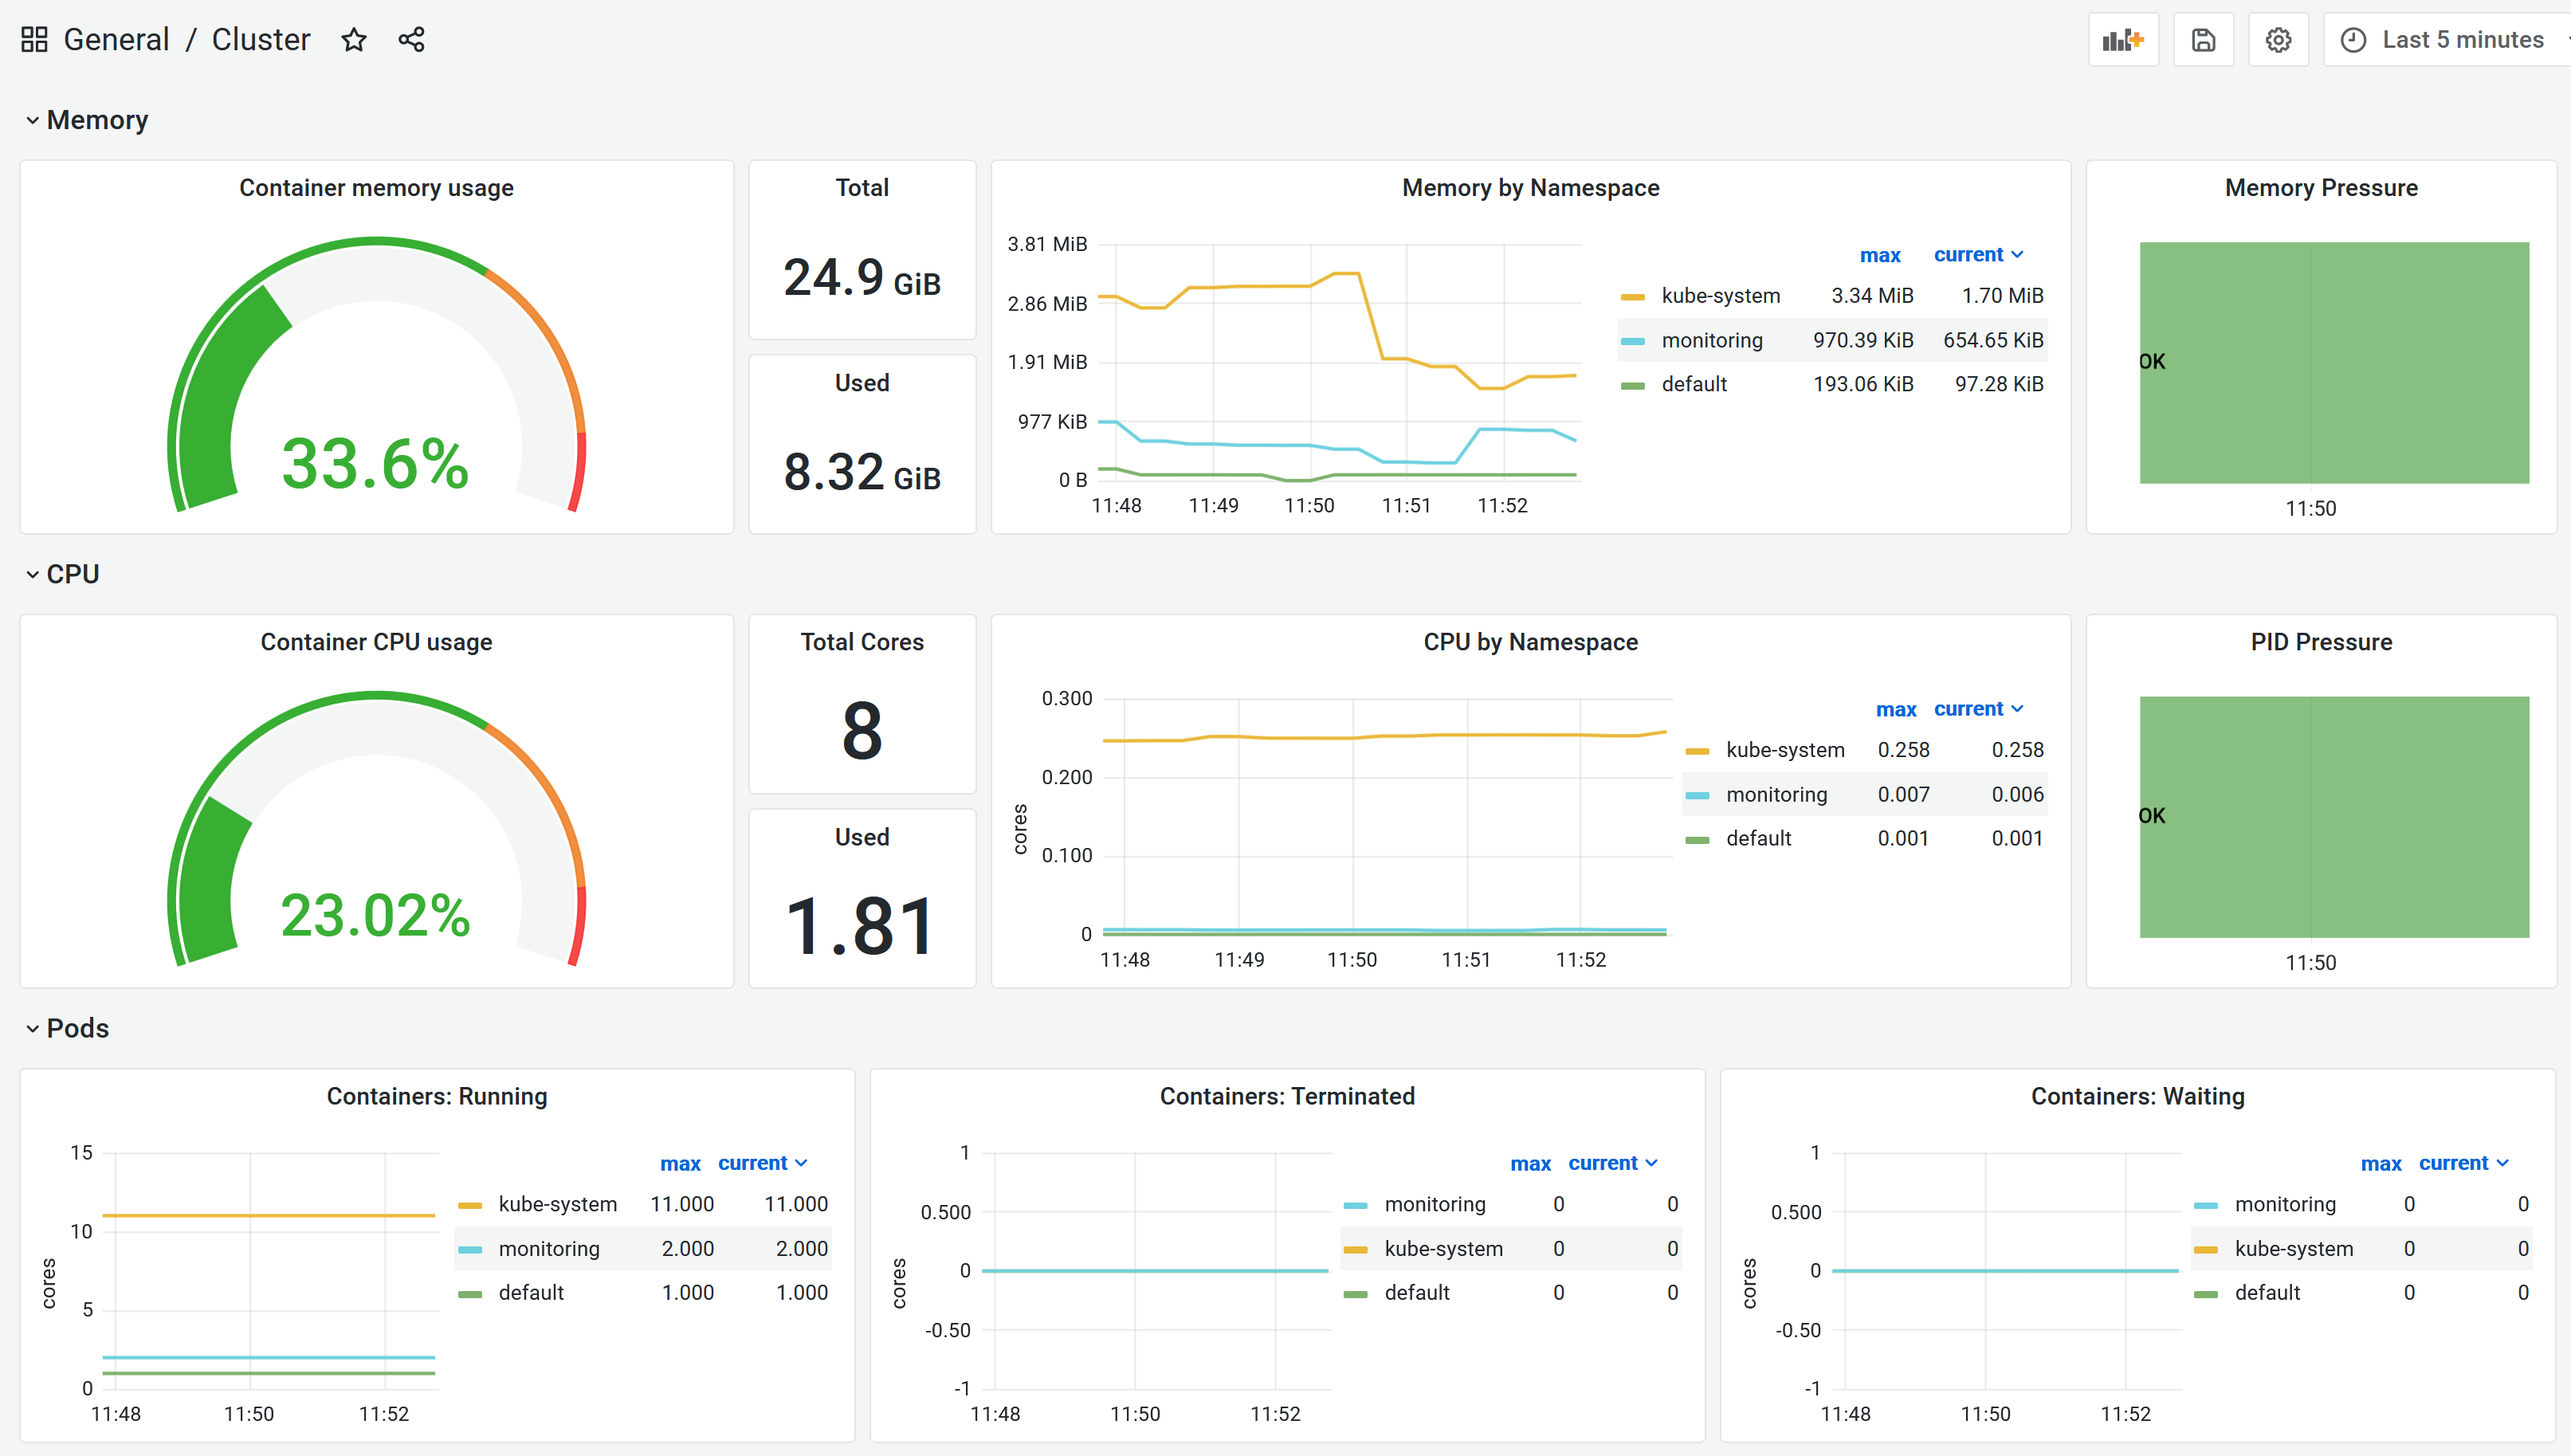
Then load the new dashbaord into Grafana:
Back to the exercises